SERVICE
LINES /
PROJECTS
RETAIL
Click
above to review these service lines in more detail.
RETAIL / OTHER
SEGMENTATION
PRODUCT LINE REDESIGN
PREDICTIVE ANALYTICS
INNOVATION
VIDEO
CENTER
CONSULTING
PLATFORMS
SOFTWARE
SOLUTIONS BY INDUSTRY
Back to Top
SERVICE LINE: SEGMENTATION
EXAMPLE CLIENT #1:
EXAMPLE CLIENT #2:
One of the top two U.S. beverage firms.
McDonald's
1993-Present
SUMMARY
OBJECTIVES
RESULTS
DSE TECHNOLOGIES USED
DIFFERENTIATION
On the heels of our segmentation success in the Financial Services industry* we brought the same technology of VALUE-BASED segmentation to the retail industry. For objectives, results, technologies and differentiation roll over the tabs above.
* = DSS partnered with Accenture in the National Retail Banking Buyer Value Study. The NRBBVS still the largest advanced segmentation study ever deployed in the banking industry.
- Identify the key buyer value segments in the retail beverage market and the QSR (Quick Service Restaurant) market using buyer value-based segmentation.
- Identify and prioritize the key product feature changes that will that will maximize sales, deepen habituation and reduce customer attrition. Do so for every beverage category.
- Perform follow on innovation research using the same date. See the innovation business line in the overview
-
Existing segmentation strategies DO NOT link to sales because they are not based on the the most important factors. To link to sales one must:
- Reproduce the actual choice (point of purchase) decision.
- Force consumers to make the same trade-offs they make in real life.
- Do NOT blindly believe what consumers say. Only 20% of consumers can accurately TELL you the rank order of their top five attributes.
- TRADITIONAL FOCUS GROUPS FAIL TO ARRIVE AT CORE BUYER VALUES. instead one needs to reproduce the real-world TRADE-OFFS faced by the consumer.
- Main Segments: Comfort, Nutrition, Speed, Service, Price, Relationship.
- Adaptive Pairwise Trade-off Surveying: reproduces the real-world trade-offs and learns from prior answers to customize the survey to each consumer.
- Advanced Algorithms Find What Is Truly Important: Hundreds of combinations algorithms, sub-algorithms, iterations, weighting of survey sections uncovers the "utilities" that result in the simulator making the same choices as the consumer.
- SegmentSolveTM: is an innovative segmentation platforms that uses 13 separate algorithms to converge upon the most highly separated consumer segments.
- ProductSolveTM: is a goal-solving market simulator that solves for the real-world importance for each key driver. This creates a virtual consumer and thus eliminates the need to write and deploy endless surveys. In contrast, ProductSolve creates new products in the simulator and discover which products consumers will buy, retain, etc.)
- Gets Down to the Bedrock - the Real "Key Drivers": adaptive trade-off whittles down the factors (attributes) that "move the needle" for any of 12 outcomes (sales, retention, etc.).
- Industry-Leading Accuracy in Quantifying Those Key Drivers : via the use of hundreds of combinations algorithms, iterations, and weighting of survey sections.
- Produces the Strategies That Maximize Bang for the Buck: via goal-solving simulators
- You Get the Fishing Pole Not the Fish: By capturing values (what's important) we no longer need to create endless surveys. Instead we create new products in the simulator to discover which products consumers will buy and which will maximize customer retention.
- Generates the Most Operational Value-Based Segments.: because value-based segments come "up from the data" and not out of some consultant's head. - and are defined by things you have control over - price, speed, menu options, etc.
Back to Top
SERVICE LINE: PRODUCT REDESIGN
SERVICE LINE NAME:
EXAMPLE CLIENTS:
REBOOT: Retail Product Line Re-Design
1995-Present
One of the World's Largest Department Stores, Others
SUMMARY
OBJECTIVES
RESULTS
DSE TECHNOLOGIES USED
DIFFERENTIATION
REBOOT is based on a simple idea. If you build what consumers really want...they will come!
After performing more advanced, multi-business line buyer value-based research projects for top 20 U.S. banks than any other strategy firm worldwide, we adapted the tools and technologies from that business line into the retail vertical. Roll-over the tabs above to see what we found!
- Re-engineer all business lines (clothing, hardware, housewares, etc.) to better meet consumer preferences while lowering cost-to-serve.
-
For each business vertical:
- Identify "trade-offs" attributes, drivers we that are NOT differentially important. De-service those attributes in order to lower the overall cost-to-serve.
- Identify new delivery configurations that will grab preference share for non-customers.
- Identify blunting strategies; strategies that blunt competitive encroachment.
- Identify optimal service configuration that will retain consumers.
- Identify the most distinctly different segments in each vertical and the best ways to deliver service to each segment at the lowest cost.
- Re-engineer the go-to-market strategy for each vertical.
- Meeting the actual "buyer values" of consumers grows targeted customer capture (acquisition) by 5%, and deepens existing customer traffic by 5% per business line.
- Identified "trade-offs" attributes, drivers we that are NOT differentially important.
-
Tested hundreds of thousands of new retail delivery configurations in the goal solving market simulator and identified:
- New delivery configurations that will grab preference share for non-customers. Implemented the best one for all lines.
- Optimal service configuration that will retain consumers.
- Blunting strategies that protected existing products from "encroachers."
- Identified the most distinctly different consumer segments in each vertical and the best ways to deliver service to each department at the lowest cost.
- Re-engineered the go-to-market strategy for each department.
- Main Segments: Price, Service, Product breath, Relationship.
- Adaptive Pairwise Trade-off Surveying: reproduces the real-world trade-offs and learns from prior answers to customize the survey to each consumer.
- Advanced Algorithms Find What Is Truly Important: Hundreds of combinations algorithms, sub-algorithms, iterations, weighting of survey sections uncovers the "utilities" that result in the simulator making the same choices as the consumer.
- SegmentSolveTM: our market segmentation platform uses 13 separate algorithms to converge upon the most highly separated consumer segments.
- ProductSolveTM: our product strategy development platform, capturing values (what's important to the retail consumer) and then uses what-offing or goal solving to discover which products consumers will buy and which will maximize customer retention.
- PositionSolveTM: is our brand positioning platform, accurately visualizes the position of each competitor to discover how to move into currently unpopulated niches of demand.
- Gets Down to the Bedrock - the Real "Key Drivers": adaptive pairwise trade-off whittles down the factors (attributes) that really move the needle for any of 12 real-world outcomes (sales, retention, etc.).
- Industry-Leading Accuracy in Quantifying Those Key Drivers: by testing hundreds of combinations of parameters (algorithms, section weights, etc.) to find the optimal key driver importance scores (utilities) that yield the maximal fit to real-world choices.
- Produces the Strategies That Maximize Profit: via our goal-solving simulator.
- You Get the Fishing Pole Not the Fish: By capturing values (what's important to the consumer) we no longer need to create endless surveys. Instead we create new products in the simulator to discover which products consumers will buy and which will maximize customer retention.
- Generates the Most THOROUGH Recommendations: Because our goal-solving simulation platform tests hundreds of millions of strategies to discover those that maximize revenue at lowest cost to implement).
Back to Top
SERVICE LINE: PREDICTIVE ANALYTICS
EXAMPLE PROJECT:
Ultra-High Performance Data Mining (UHP-DM)
1995-Present
CLIENTS:
Leading US Retail and Financial Service Firms
SUMMARY
OBJECTIVES
RESULTS
DSE TECHNOLOGIES USED
DIFFERENTIATION
The average data mining analyst builds about a dozen predictive models per week. What if data mining could be automated to produce millions of models per week? The UHP-DM framework is a fundamental rethinking of how to transform data mining from the ground up. UHP-DM sees data mining as a solution space of potential models with six primary dimensions: data transforms, model form, algorithms, sub-algorithms, iterations, and criteria. By building a data mining assembly line that penetrates this solution space, we can zero in on high performance volumes within the solution space. For the technologies that achieve this, see the DSE TECH section above.
- Perform initial-sell, up-sell-cross sell (etc., etc) far better (higher lift.)
- Perform initial-sell, up-sell-cross sell (etc., etc) far less expensively.
- 10% higher lift on average than "best practice" software or consulting . (See why by inspecting the technologies described in the next tab.)
- Deployed cost: 25% of the cost of traditional consulting approaches without the need to re-architect the datamart.
UHP-DM is software development project fifteen years in the making. It has yielded two linked applications; VISTAR and BigDataSolve.
- VISTAR: is our automated subdatamart reduction engine that identifies the best predictor combinations to maximize the desired outcome (objective function).
- BigDataSolveTM takes those variables and runs millions of models within that solution space. It does so by creating a solution space that automatically rotates algorithms, sub-algorithms, iterations, criteria and transforms against the problem, This typically results in millions of model combinations that probabilistically yields higher lift.
- Distributed Computing: UHP-DM uses distributed computing by turning regular laptops in a network into a virtual supercomputer.
- DELTA: a form of validation (Differential Enhancement of Lift Through Arbitration) that yields higher lift by finding subgroups with higher predictive performance.
The Differentiation of our UHP-DM (Ultra-High Performance Data Mining) practice is industry-leading. In two simple ways. It is:
- Far Less Expensive: Let's cut to the chase, shall we? Consulting firms still rely on a standard formula 1) Scaring their clients to death with what is (mostly) the truth 2) Convincing their clients to spend ten times as much capital in a) rearchitecting their datastore/dataflow and b) buying expensive proprietary, closed-architecture analytics. In stark contrast, UHP-DM:
-
Gives You What You Need Far Less Expensively...But With BETTER Results
:
There are only four keys to ultra-high performance data mining. Our approach addresses them all:
- Getting the Right Predictors and Cleaning Them Thoroughly (See VISTAR.)
- Finding the Algorithms/Transforms That Predict Best (See BigDataSolveTM.)
- Doing it Fast with Inexpensive Distributed Computing: (See BigDataSolve / DPTM.)
- Validating Exhaustively...in a Way That Increase Predictive Fit: (See DELTA.)
Back to Top
SERVICE LINE: INNOVATION
SERVICE LINE:
EXAMPLE CLIENT:
Retail Product Innovation
1996-Present
One of the Two Largest Beverage Firms Worldwide, Others
SUMMARY
OBJECTIVES
RESULTS
DSE TECHNOLOGIES USED
DIFFERENTIATION
Innovation is all the rage. And for good reason. Only so much growth can come from M&A...and only so much margin can be obtained through better management practices. Fundamentally, business recognize that mature markets require active and continuous innovation to achieve sustained competitive advantage. But how does one come up with that elusive new category or that elusive new idea?
DSS's insight? Innovation is fundamentally defined as building new services in LATENT areas of demand. Said mathematically innovation discovers unmet volumes of demand in a multivariate need space. Our ideas in innovation were, well, so innovative that they earned us a main stage presentation at the prestigious annual ART (Advanced Research Techniques) forum. Click on the tabs above to learn how our Innovation Practice used our DSE platform InnovationSolve to enable one of the word's largest retail companies to find and fill undiscovered niches of demand.
-
Innovate by:
- Discovering need states of consumers. This involves down-selecting to ensure we are measuring the needs that actually link to revenue.
- Discovering unmet areas of demand. This means a) finding the optimal conformation of the need space using a variety of data reduction approaches b) visualizing where demand "lands" on the need space.
- Comparing existing product or service offerings to those demand volumes.
- Discovering and quantifying unmet areas of demand (Volumes where there is demand but no product to meet it.)
-
For a leading beverage manufacturer we:
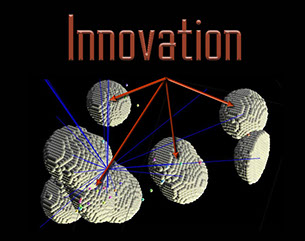
- Created a brand landscape (a 3-D map) where the mathematics located a) needs b) need segments c) existing products and d) demand volumes. (The white spheres above are the demand volumes in the brand landscape.
- Demonstrated 13 major demand volumes in the USA beverage marketplace.
- Demonstrated that the existing market segmentation created by another marketing firm did not align the actual volumes of demand in the marketplace
- Predicted that the innovation proposal developed at great expense by that other marketing company would certainly fail to meet its market targets because of cannibalization. We projected that the current innovation proposal would achieve only 1.5% market share. (2.5% was break even.) Our projections were spot on.
- Suggested a dozen better strategies that would garner more market share. The implementation success of that initiative is remarkable...but is still covered under confidentiality agreements.
- Advanced Math to Find What's Truly Important: used hundreds of combinations of algorithms, sub-algorithms, iteration.,criteria so that the brand landscape maximized the amount of information in the fewest dimensions,
- SegmentSolveTM: which uses 13 separate algorithms to discover the most distinct segments.
-
InnovationSolveTM
: an innovation platform that:
- Finds the optimal conformation of the space using data reduction approaches
- Visualizes where demand "lands" on the need space
- Compares existing product or service offerings to those demand volumes
- Discovers and quantifies unmet areas of demand (Volumes where there is demand but no product to meet it.)
- Recommends which products and services will gain maximal share from competitors
- Recommends which products and services will cause the least cannibalization
- Recommends new products that will create demand (e.g. discovers unmet needs.)
In contrast to all other Innovation approaches, DSS's Innovation practice:
-
- Fnds the optimal conformation of the need space using multiple data reduction methods.
- Visualizes where demand "lands" on the need space.
- Compares existing product or service offerings to those demand volumes.
- Discovers and quantifies unmet areas of demand (Volumes where there is demand but no product to meet it.)
- Recommends which products and services will gain maximal share from competitors.
- Recommends which products will cause the least cannibalization.
- Recommends new products that will create demand.
SCROLL